 Vanta Panel
The vPanel Dashboard
A tour of the vPanel dashboard: the tool grid, the status cards that appear only for services your host has enabled, and why a tile might be missing.
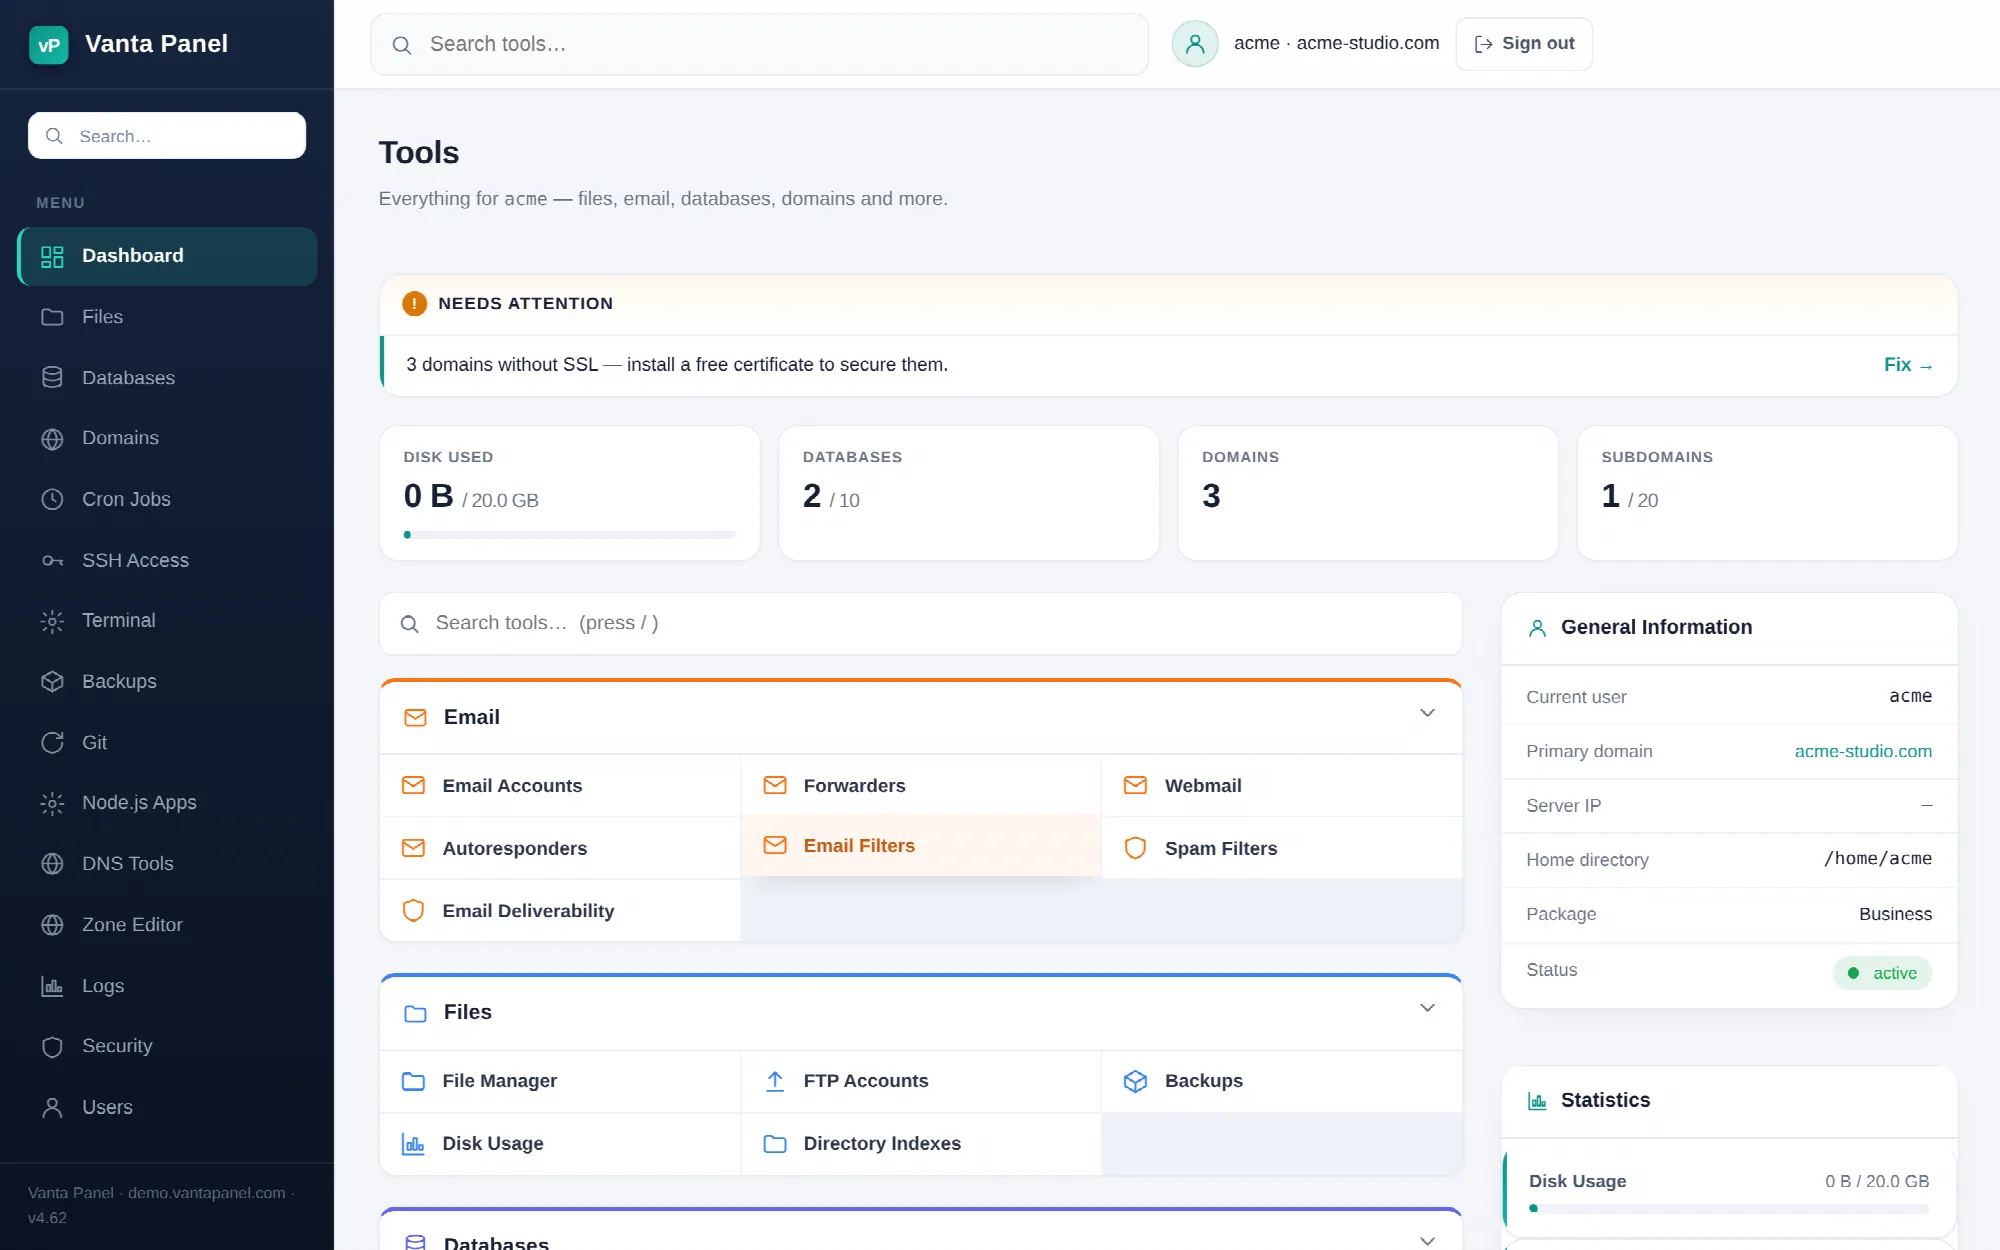 The vPanel dashboard.
The vPanel dashboard is the first thing you see after signing in to a hosting account. It is a grid of tiles, one per tool, plus status cards for anything the administrator has enabled for your account.
The tool grid
Every tile opens one area of the panel. The full set:
| Tile | What it is for |
|---|---|
| Files | Browse, edit and upload your site files |
| Databases | MySQL databases and users |
| Domains | Addon domains and subdomains |
| Cron Jobs | Scheduled commands |
| SSH Access | SSH keys for shell access |
| Terminal | A shell in the browser |
| Backups | Create, download and restore backups |
| Java Apps | Run .jar files as managed services |
| Python Apps | Managed virtualenv apps |
| Kafka | Per-account event streaming |
| DNS Tools | DNS helpers |
| Zone Editor | Edit DNS records directly |
| Security | Two-factor authentication, IP blocking and more |
| Users | Delegate access to other people |
Email, SSL, PHP version and the rest are reached from the navigation rather than the grid.
Status cards
Some cards appear only when the administrator has switched the corresponding service on for your account — Redis is the clearest example. If a service is not enabled, its card is simply absent rather than shown as broken. Ask your host if you expect one and do not see it.
If a tile is missing
Two reasons a tile you expected is not there:
- The service is not enabled for your account. Java, Kafka, Redis and Python are enabled per account by the administrator in vWHM.
- You are signed in as a delegated user whose permissions do not include that area. See User Manager for how those permissions work.