 Vanta Panel
Server Status
The live vitals page in vWHM: CPU load, memory, disk and swap gauges, uptime, process count, the worker bridge check and core service health, refreshed every three seconds.
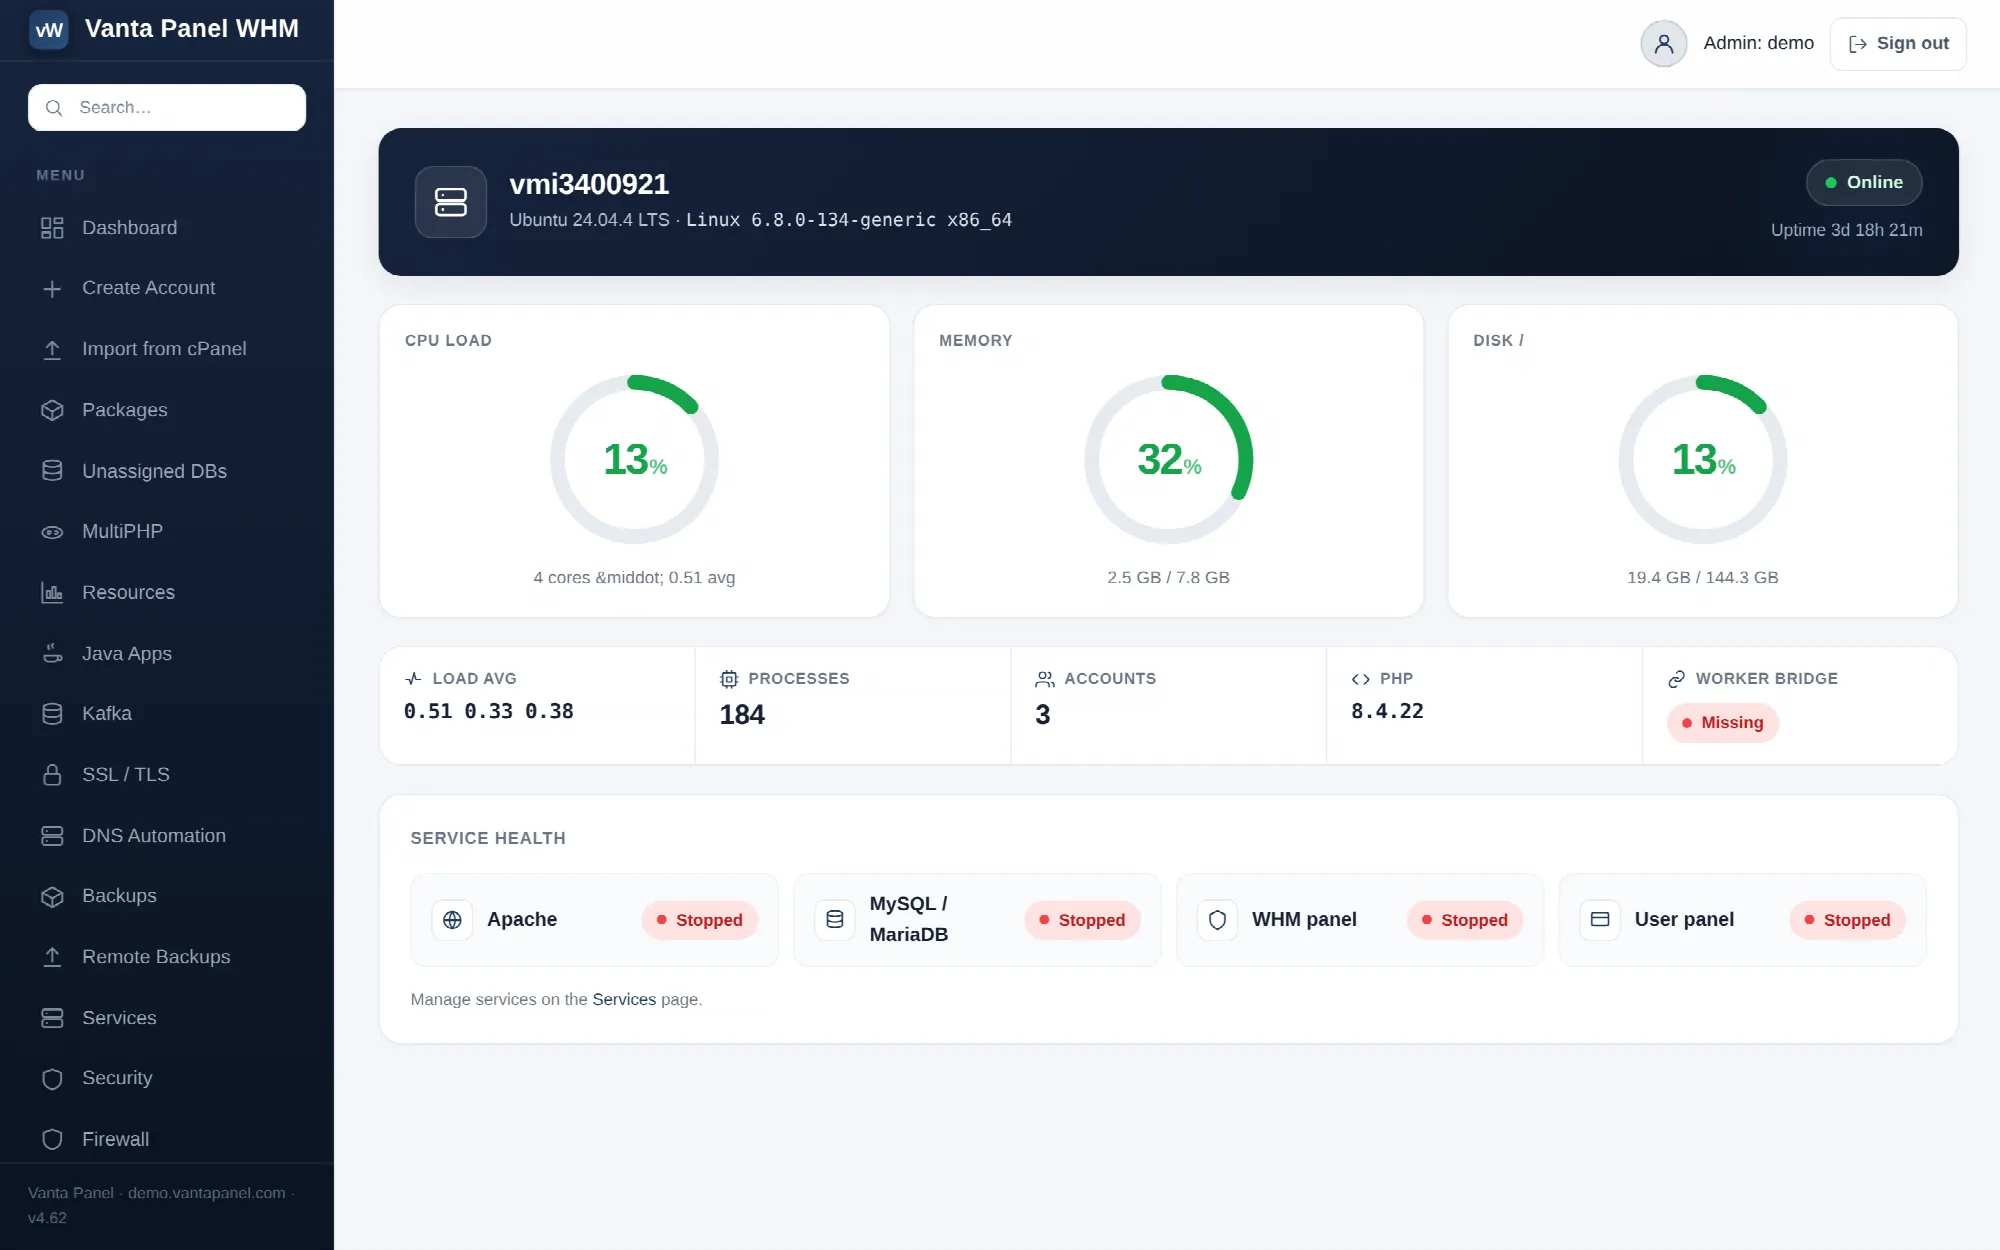 Live server status gauges in vWHM.
Server Status (vWHM → Server Status) is the live vitals page for the machine. It is read-only — there are no buttons and nothing on it can change the server. The gauges and counters are read straight out of /proc with no privileged call at all; only the four service chips go through the privileged worker, which runs systemctl is-active for each. That is why the page is cheap enough to refresh continuously.
Header
Hostname, the operating system's pretty name, the kernel release and the architecture, plus an uptime counter.
Gauges
Four ring gauges, each colour-coded: green below 70%, amber from 70%, red from 90%.
- CPU Load — the 1-minute load average divided by the core count, as a percentage. The subtitle gives the core count and the raw average. A load equal to your core count reads as 100%, which is fully busy but not necessarily a problem. The figure is not capped, so a load of twice your core count reads as 200%.
- Memory — used against total, where "used" is
MemTotalminusMemAvailable. That is the figure you want: it does not count reclaimable cache as used, so it will not scare you the wayfreeoutput can. - Disk / — used against total on the root filesystem only. If you mount
/homeseparately, this gauge does not describe your customers' space; use Resource overview for that. - Swap — used against total. This gauge only appears if the server actually has swap configured.
Information strip
Five cells below the gauges:
- Load avg — all three load averages (1, 5 and 15 minute).
- Processes — the current process count.
- Accounts — how many hosting accounts exist.
- PHP — the PHP version the panel itself is running under. This is not the version your customers' sites use — see PHP versions and account isolation for that.
- Worker bridge — Installed or Missing. This is whether the privileged worker script exists at its configured path. If it reads Missing, most of vWHM cannot function, because every operation needing root goes through it.
Service health
Four services with a status chip each: Apache, MySQL / MariaDB, WHM panel and User panel. The database unit is resolved once per request — mariadb if that unit is active, otherwise mysql — so either packaging reports correctly.
The three-second refresh uses the same unit resolution as the initial page load, so the database chip cannot disagree with itself between the two.
Each chip reads Running, Stopped or Unknown, where Unknown means the worker did not answer for that unit. To restart anything, go to Services — this page only observes.
The live refresh
Three seconds after the page loads, the browser starts polling a small JSON endpoint on the same page and keeps doing so every three seconds. Each poll re-reads the gauges, uptime, load averages, process count and all four service states, and the rings animate to their new values.
If a poll fails or returns an error, the "live" tag in the header turns red and the poll retries in five seconds instead of three. The page never stops trying, so a status page left open on a second monitor recovers on its own after a panel restart.
Reading it in practice
The two numbers worth alerting on are disk and memory. Disk filling up is the failure that takes down every site at once and is completely predictable; memory pressure shows up first as swap climbing.
Rather than watching this page, set thresholds and let the server email you. Server alerts are configured under Panel settings, with separate thresholds for disk, memory and CPU load, a cooldown so you are not spammed, and a single "resolved" note when a condition clears.