 Vanta Panel
Visitors — Recent Traffic from Access Logs
Recent traffic in detail: top pages with static assets filtered out, external referrers, busiest IP addresses, user agents, and the last 25 requests with status codes — read straight from your access logs.
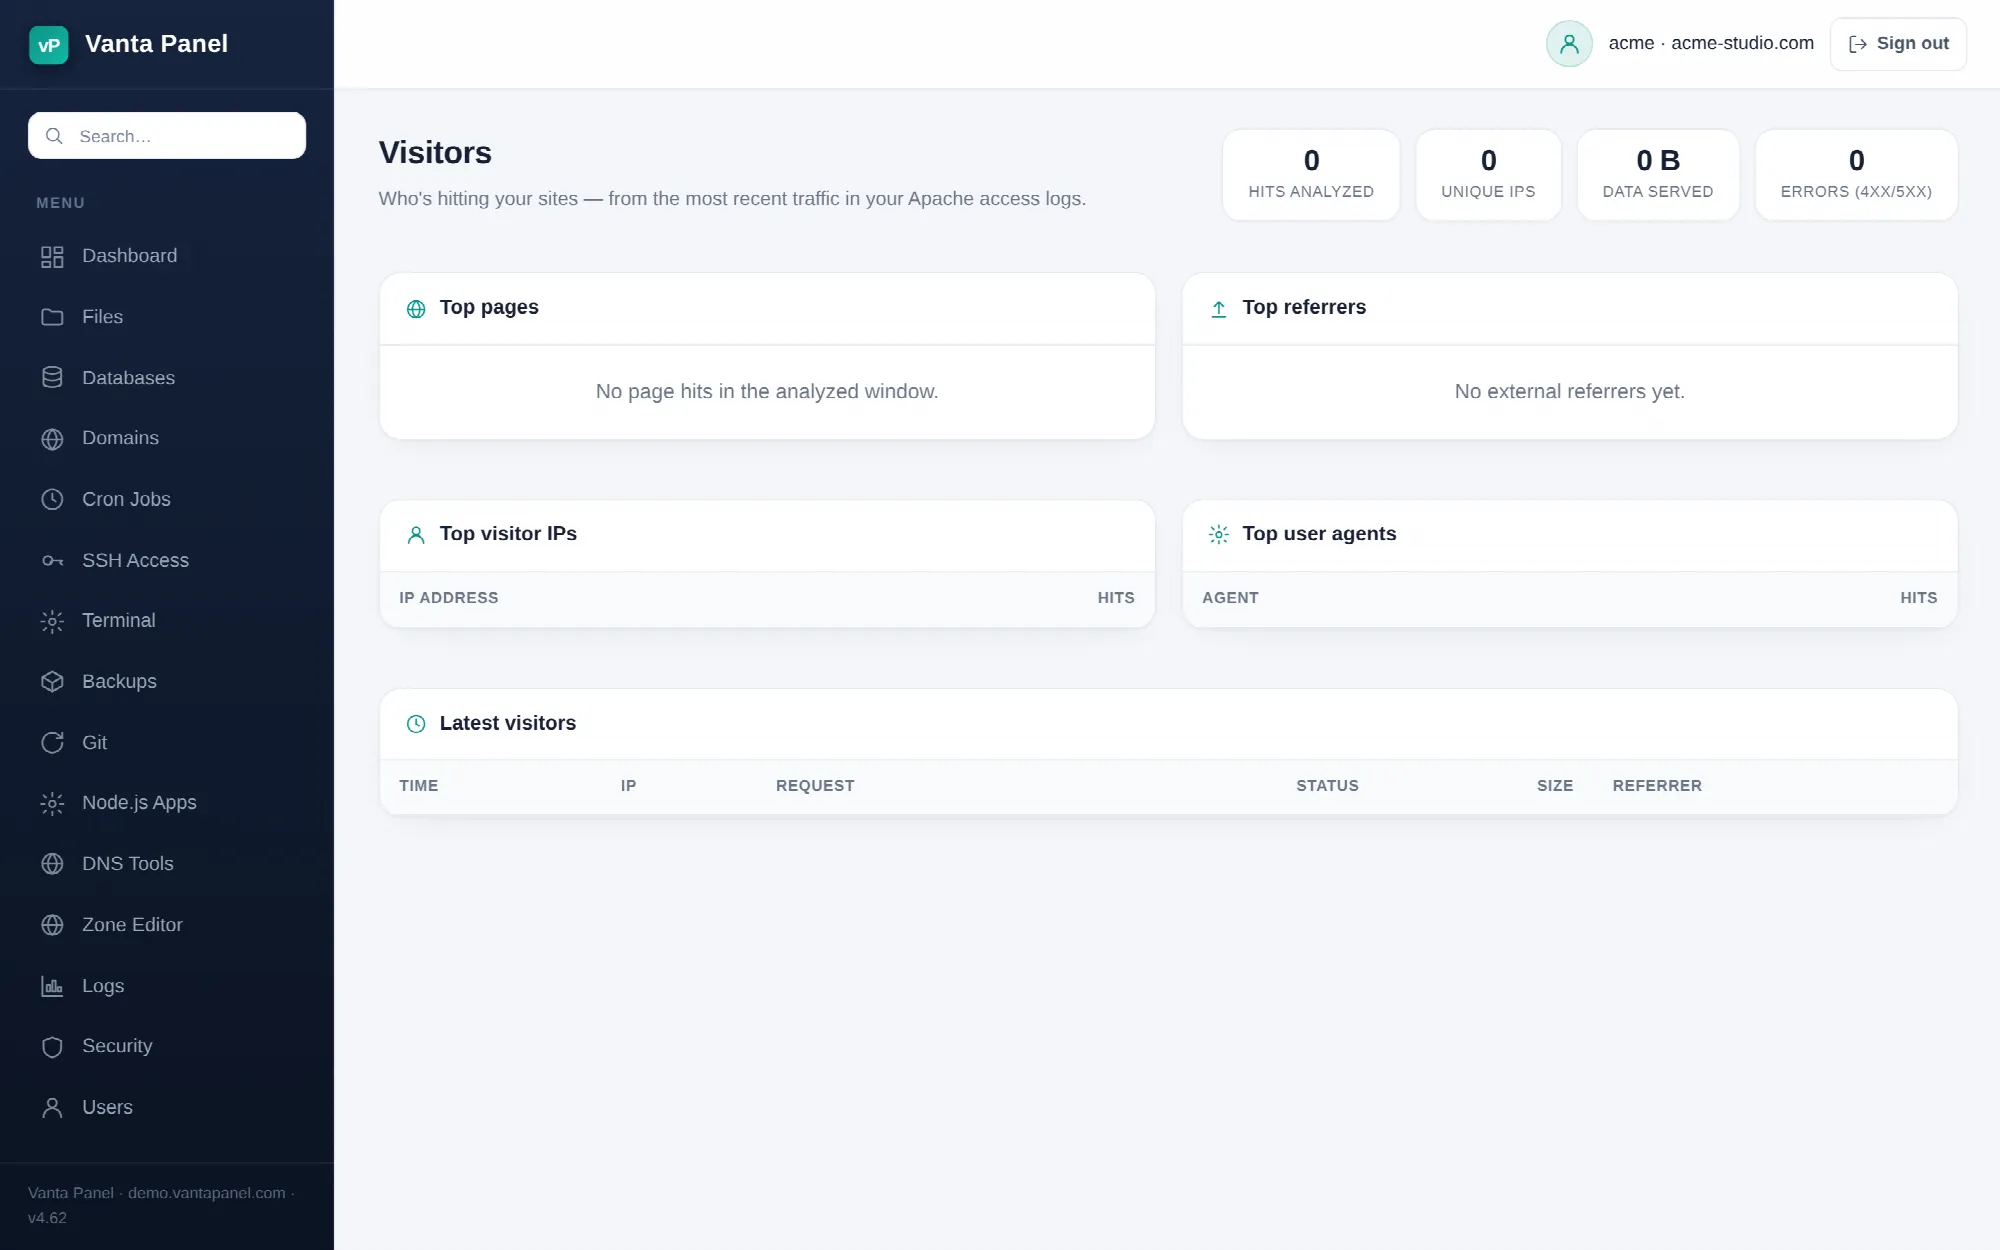 Recent visitor detail read from the access logs in vPanel.
Visitors (vPanel Dashboard → Preferences → Visitors) shows who has been hitting your sites recently — top pages, referrers, IP addresses, user agents, and a request-by-request list of the latest arrivals. Where Metrics gives you two weeks of totals, Visitors gives you detail on the traffic that just happened.
It reads the tail of your Apache access logs, so it needs no tracking code and it sees everything the web server saw, bots included. If your site has had no traffic yet, the page says so.
The four headline numbers
- Hits analyzed — how many log lines went into this view. This is a window on recent traffic, not an all-time total.
- Unique IPs — distinct client addresses in that window.
- Data served — response bytes across those hits.
- Errors (4xx/5xx) — the combined count of client and server error responses.
Top pages
The ten most-requested paths, with static assets filtered out. Requests for .css, .js, images (.png, .jpg, .gif, .svg, .webp, .avif, .ico), fonts, video, .txt, .xml and source maps are excluded, and paths longer than 120 characters are skipped. What remains is much closer to real pages than a raw log grep would give you.
Top referrers
The ten external sites sending you traffic, grouped by hostname. Your own domains are removed, so your internal navigation does not swamp the list — which means what is left is genuinely inbound: search engines, links from other sites, and social platforms.
An empty list is normal for a new site, or for one whose visitors arrive by typing the address. Note that most browsers no longer send a referrer on HTTPS-to-HTTPS navigation from a different site unless that site opts in, so this list undercounts real referrals.
Top visitor IPs
The ten busiest client addresses. Worth checking when traffic looks wrong: one address responsible for a large share of your hits is usually a crawler, a monitoring service, or something scraping you. Cross-check it against the user agent list, and if it is abusive, block it with IP Blocker.
Top user agents
The five most common User-Agent strings, truncated to 100 characters. This is how you tell a traffic spike apart from a bot swarm — real browsers announce themselves as Mozilla/Chrome/Safari builds, while crawlers, uptime monitors and scripted clients name themselves plainly (or send something obviously fake).
Latest visitors
The 25 most recent requests, newest first:
| Column | What it shows |
|---|---|
| Time | the timestamp from the log line |
| IP | the client address |
| Request | method and path |
| Status | the response code, colour-coded green / blue / amber / red for 2xx / 3xx / 4xx / 5xx |
| Size | response bytes, or a dash where the log recorded none |
| Referrer | where the request came from, if it sent one |
This table is the one to open when someone tells you "the site just broke". You can see the exact request that returned a 500, the exact 404 path someone is hitting, and whether a suspicious request came from one address or many.
How much traffic it looks at
The panel reads the tail of each of your account's access log files. The number of lines it takes per file shrinks as you add more log files, so that a site with many domains does not read many times more data than a site with one — a total budget of around 20,000 lines is shared across the files, with a floor of 2,000 lines each.
Two consequences:
- On a very busy site the window may only reach back a few minutes. Recent detail is the point of the page; for longer trends use Metrics.
- Lines that do not match the expected combined log format are skipped, so the analysed count can be lower than the number of lines read.
Related pages
- Metrics — 14-day totals, a daily request chart and response-code shares.
- Logs — the raw access and error logs, unfiltered.
- IP Blocker — block an address you found here.