 Vanta Panel
Access and Error Logs
Read the tail of your Apache error and access logs in vPanel. What the common PHP and Apache error lines mean, how to read a combined access-log line, and a step-by-step loop for pinning down a 500.
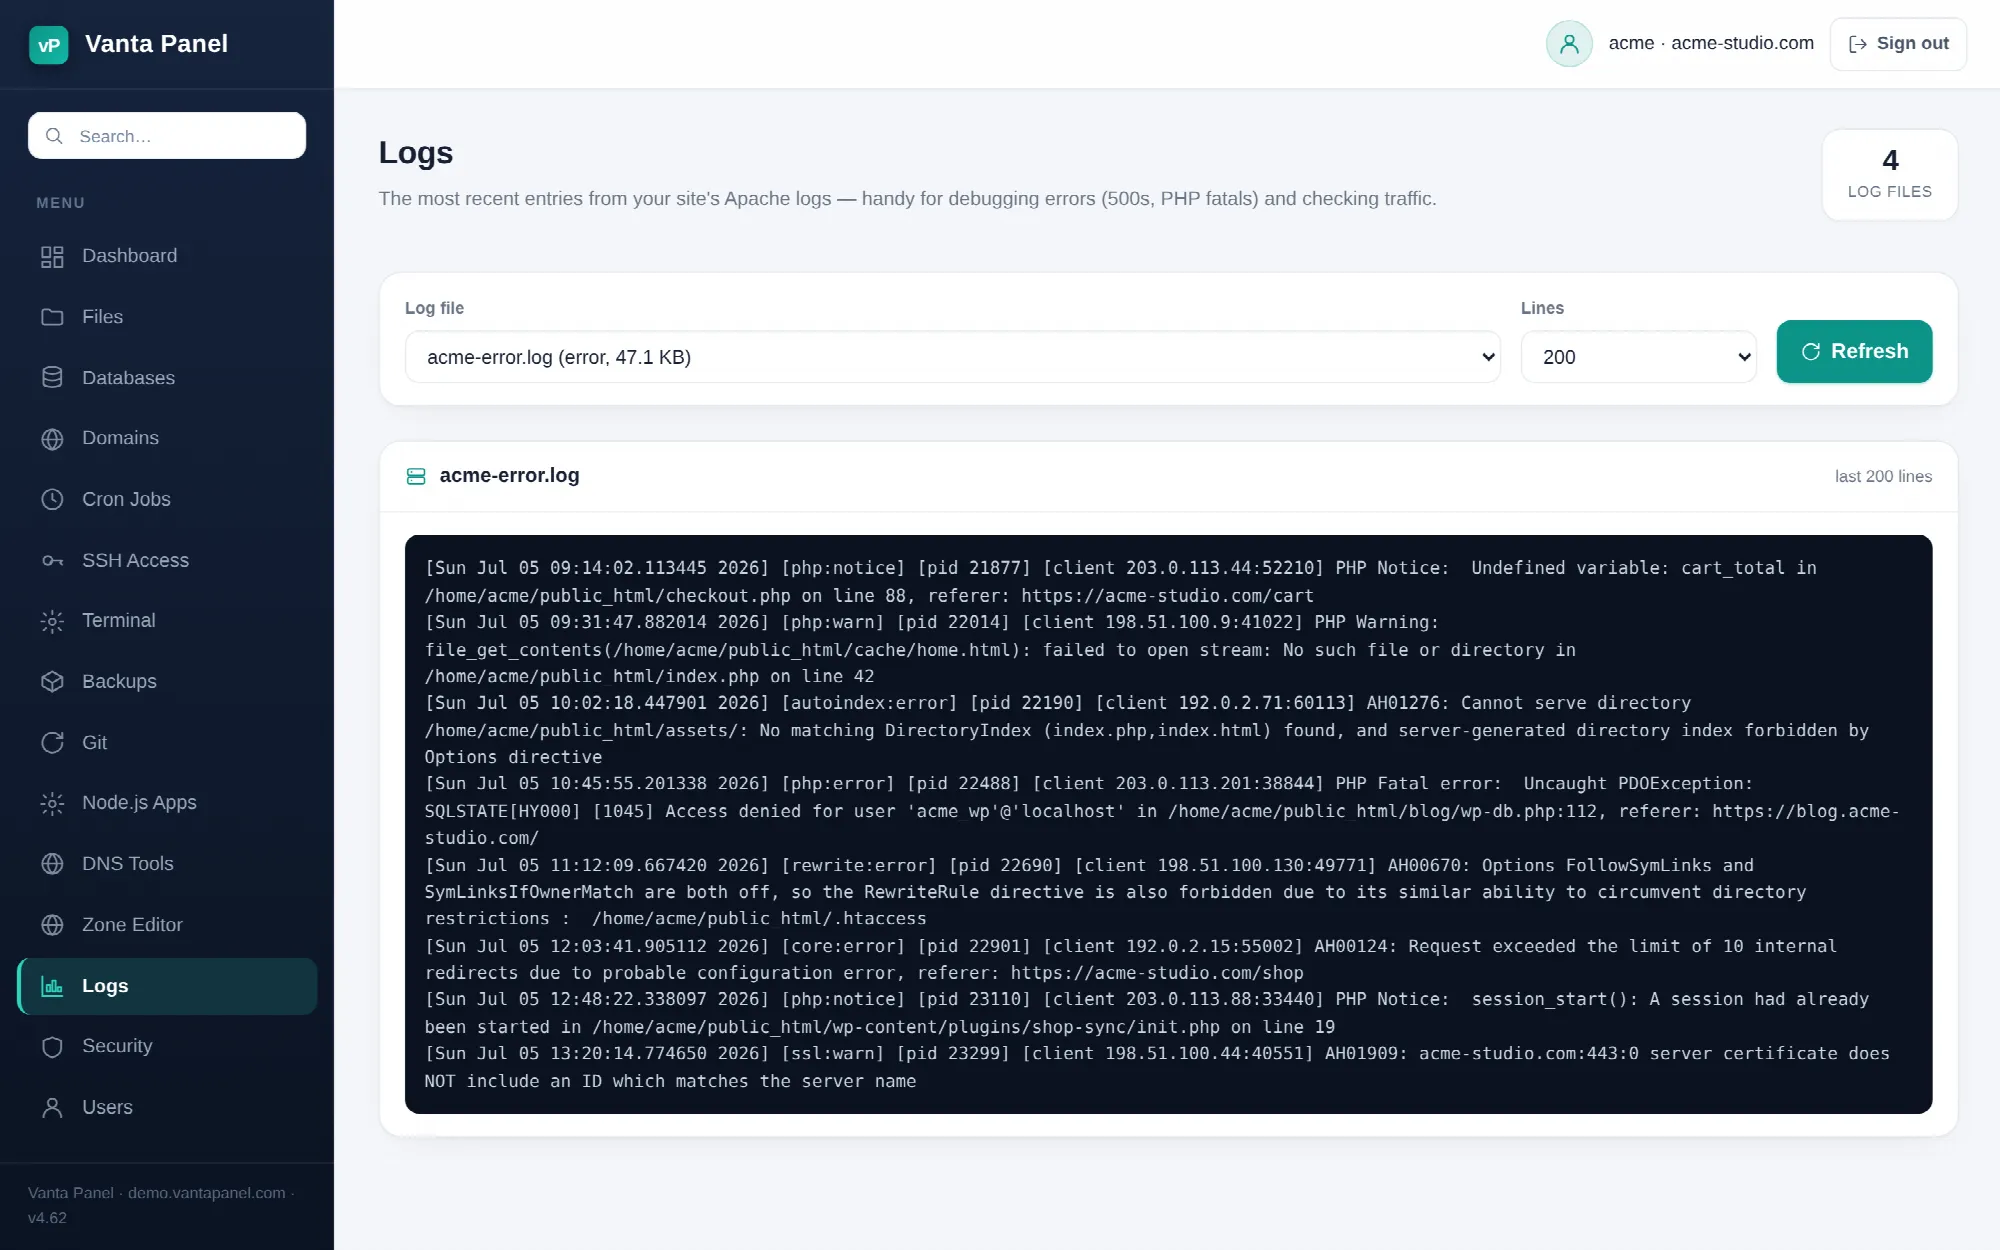 Reading Apache access and error logs in vPanel.
Logs (vPanel → Logs) shows the most recent lines from your site's Apache logs, straight from the server. This is where you go when a page returns a 500, a form silently fails, or a script stops working and you need the actual reason rather than a guess.
Choosing a log
The dropdown lists the log files belonging to your account, each labelled with its kind and its size on disk. Two kinds exist:
- error — Apache's error log for your account, and the destination for PHP warnings, notices and fatal errors. This is the one you want when something is broken.
- access — one line per request received: client address, timestamp, method and path, response code and response size.
The error log is preselected when you open the page, because that is what you almost always need. If it is not present, the first available log is selected instead.
Lines controls how much of the tail is shown — 100, 200, 500 or 1000, with 200 as the default. The panel reads from the end of the file, so raising it does not slow things down noticeably even on a large log. Refresh re-reads the file; there is no live streaming, so refresh after reproducing a problem.
You can only open logs belonging to your own account. A log that is listed but has since gone from disk shows a note saying there are no entries yet, and one that exists but is empty says it is empty — neither is reported as an error.
Reading the error log
Entries are newest at the bottom. A PHP error line names the file and the line number, which is usually all you need:
[Wed Jul 22 14:02:11.882 2026] [php:error] [pid 21884] [client 203.0.113.5:52344]
PHP Fatal error:  Uncaught Error: Call to undefined function mb_strlen()
in /home/acme/public_html/wp-includes/formatting.php:1204
Things worth recognising:
PHP Fatal error— the request died here. This is what a white page or a 500 looks like from the server side.Uncaught Error: Call to undefined function— a missing PHP extension. Switch PHP version or ask your host to enable the extension; see PHP Version Management.Allowed memory size ... exhausted— the script needed more memory than PHP allows.Maximum execution time ... exceeded— the script ran too long; usually an import, a backup plugin, or an external call with no timeout.Permission denied— the web server cannot read or write a file. Common right after restoring or uploading files by hand.File does not exist— a 404 at the filesystem level. Frequently a missing asset rather than a real problem.client denied by server configuration— an.htaccessor Directory Privacy rule is blocking the request.
Copy the file path and line number into the File Manager to look at the code that failed.
Reading the access log
Access lines are in the standard combined format:
203.0.113.5 - - [22/Jul/2026:14:02:10 +0000] "GET /checkout HTTP/1.1" 500 1274
"https://example.com/cart" "Mozilla/5.0 ..."
The two fields to scan are the status code and the path. A 500 tells you which URL to reproduce; the timestamp tells you which error-log entry to match it against. Working across the two logs at the same timestamp is the fastest way to connect a symptom to a cause.
A practical debugging loop
- Open the error log and set Lines to 100 — a short window is easier to read.
- Reproduce the problem in another tab.
- Come back and press Refresh. The new lines at the bottom are yours.
- If nothing new appeared, the request never reached PHP. Switch to the access log and check whether the request arrived at all and what status it got — a 404 or a 403 there means the problem is routing or permissions, not your code.
Limits and expectations
- The page shows the tail of a log, not its whole history. Something that happened days ago on a busy site has already scrolled out of the window.
- Logs are rotated by the server, so older entries move to archived files and eventually disappear. Save anything you need to keep.
- The access log is not analytics. For summaries use Metrics and Visitors, which read these same files and do the counting for you.
- The logs are kept under
/var/log/apache2, outside your home directory, so they do not count against your disk quota and they are not included in a backup. Download anything you want to keep.
Related pages
- Metrics — 14 days of traffic totals from these logs.
- Visitors — recent requests, referrers and user agents, parsed for you.
- Troubleshooting — common failures and their fixes.